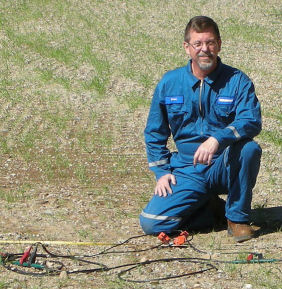
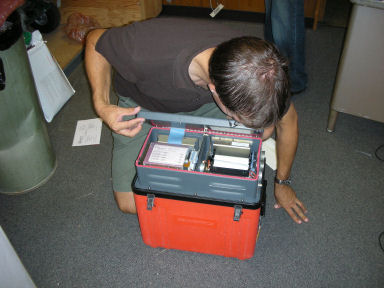
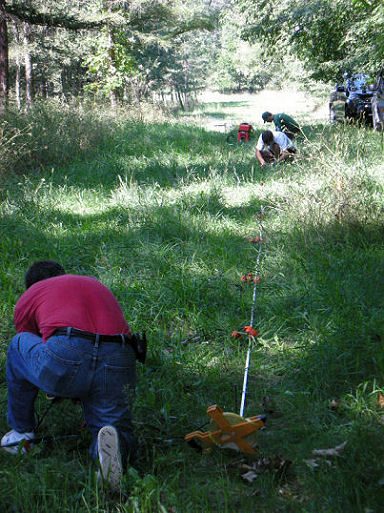
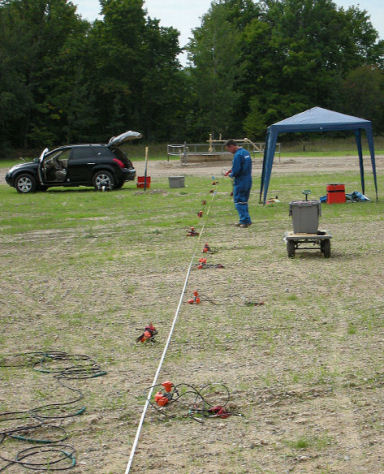
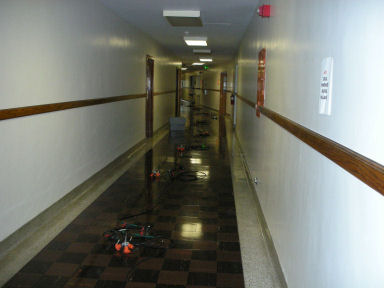
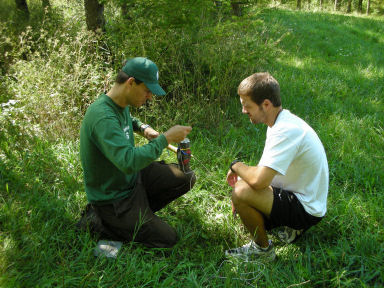
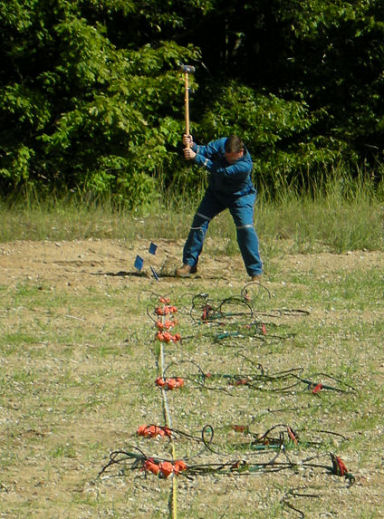
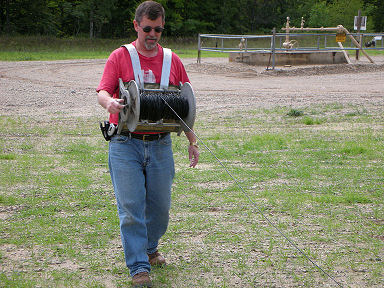
Dr. Brian Toelle

"Geophysical Special Problem" performed during Ph.D. studies.

Acquisition of Multi-component Seismic Data
during research for US Dept. of Energy.

This special project was performed during my studies at Michigan State University.

Project Description:
As part of the set of geophysical special problems I investigated during my degree studies I obtained a 3D multi-component seismic data set over the Silurian Reef that I was studying for the Department of Energy. This data was obtained at the same time the second 3D P-wave data set in the field's 4D survey was acquired. This allowed me to "piggy-back" on the P-wave survey's energy sources. I recorded the data using the department's 48 channel Geometrics Strataview equipment. Below are some photos showing the acquisition process and the equipment that was used.

Dr. Van Dam inspects the recording equipment. This small, portable unit is powered by a car battery and stores each shot record digitally on an internal drive. The rest of the equipment includes the geophones and cables.
We initially checked out the recording equipment by laying out the 3-component geophones in one of the halls in the Natural Science building during a weekend. Once the system was assembled and powered up we walked up and down the hall in order to determine which geophones were recording properly and which of the three cables related to which channels in the recorder.
Once we had established the equipment was working properly we used it to perform a 2D refraction survey in a test area near the campus. This area was also the site of an on-going hydrology study. Here Dr Van Dam wires up the sledge hammer (the striker plate is seen on the ground next to him) that is used as the source for the survey. The sledge is used to hit the striker plate in order to send compressional energy into the ground. When the hammer and the plate meet the wiring completes a circuit that starts the recorder.

For this "shake-down" the refraction line had a linear orientation with a regular spacing of 2.5 meters between each of the 3-component geophones. The large measuring tape that we used to establish this spacing is seen in the foreground of this photo. The orange colored recorder can be seen in the background near Dr. Van Dam. Once the geophones were positioned they were connect to the cables that ran to the recorder.

This refraction line was shot in order to field check the equipment prior to its use on my project. The equipment functioned properly and we obtained a good data set.

For my project we laid out the geophones in the same configuration that we had during the shake-down field test near the CO2 injection well. The well head for the injector can be seen in this photo's background just off the end of the line. Here I have laid out the geophones along the measuring tape in approximately the selected spacing (2.5 meters) in preparation for their final positioning and connecting to the cables which are seen in the left foreground. The departments little hand cart seen there on the right turned out to be an important piece of equipment as it made moving the equipment around much easier.
Prior to the shooting of the main survey that we were going to "piggy-back" on we recorded a refraction survey in order to obtain information concerning the near surface geology. Here I can be seen swinging the sledge hammer to hit the sticker plate just off the end on the line in order to send energy into the ground.
Of course at the end of the recording all the equipment had to be picked up and stowed away properly for its return to the university. Here I am rolling up the trigger wire that connects the hammer / striker plate to the recorder.

I found this project to be quite enjoyable. As mainly a seismic interpreter I do not get out into the field as often as would like and I found that this project was good experience.